Major Projects Performance Report
Victorian Office of the Auditor General
Streamlining VAGO’s reporting with user research and practical improvements.

The brief
VAGO publishes the Major Projects Performance Report each financial year to help Parliament and the community understand how major capital projects are tracking against cost, time, scope and benefits.
The experience is delivered through two connected products:
A PDF report tabled in Parliament
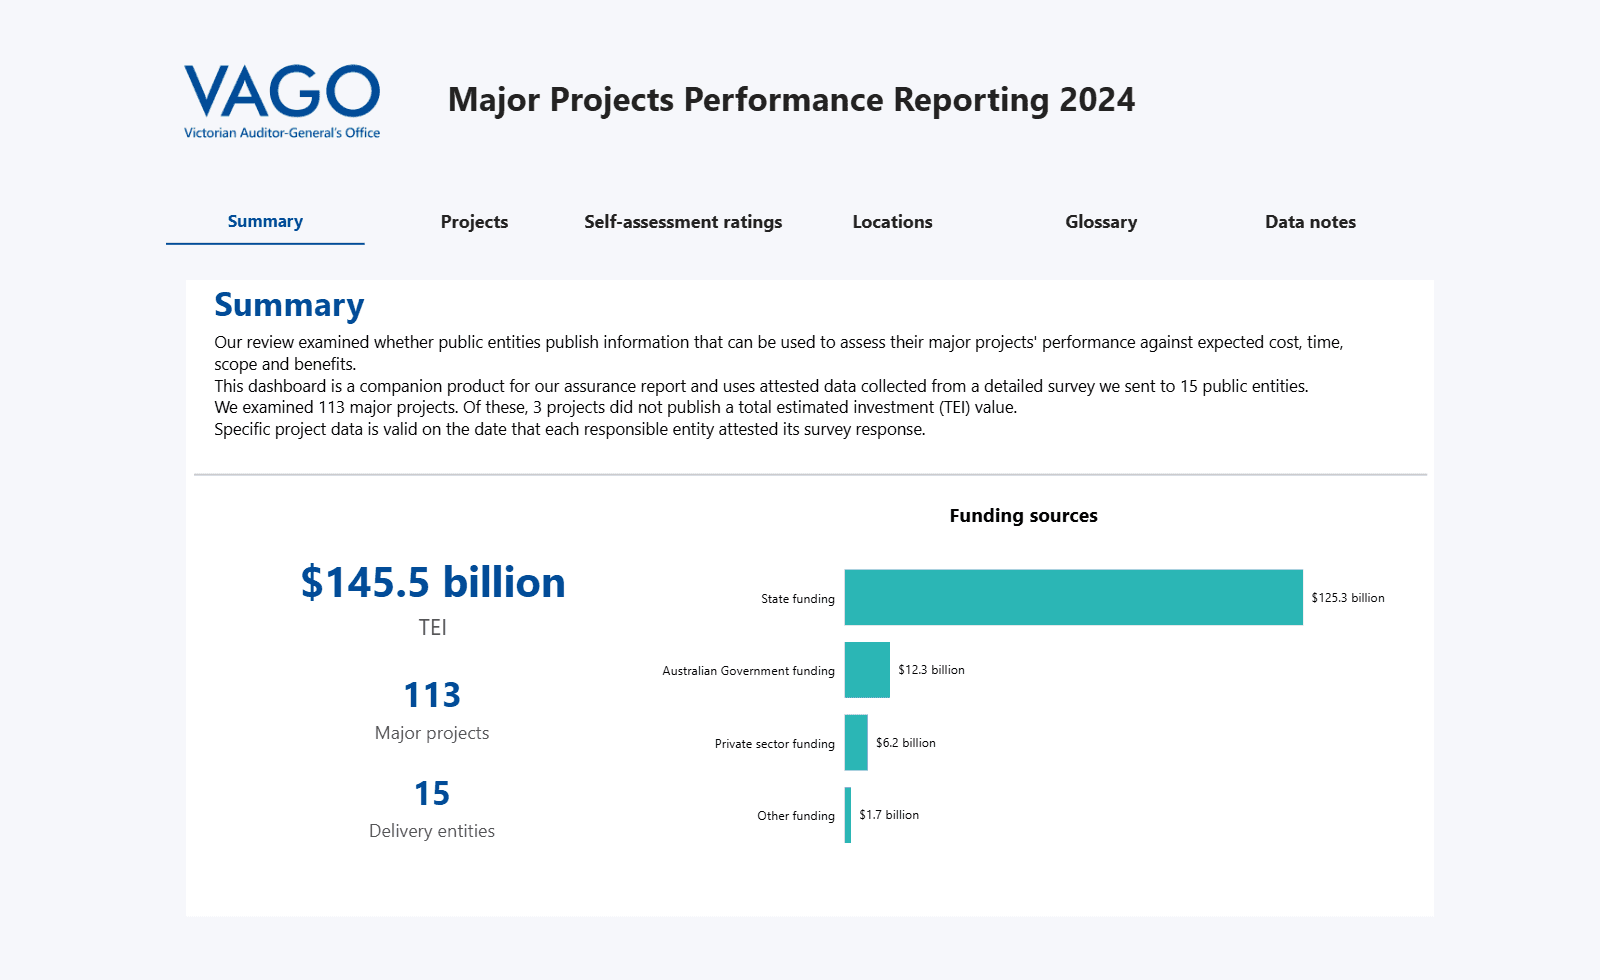
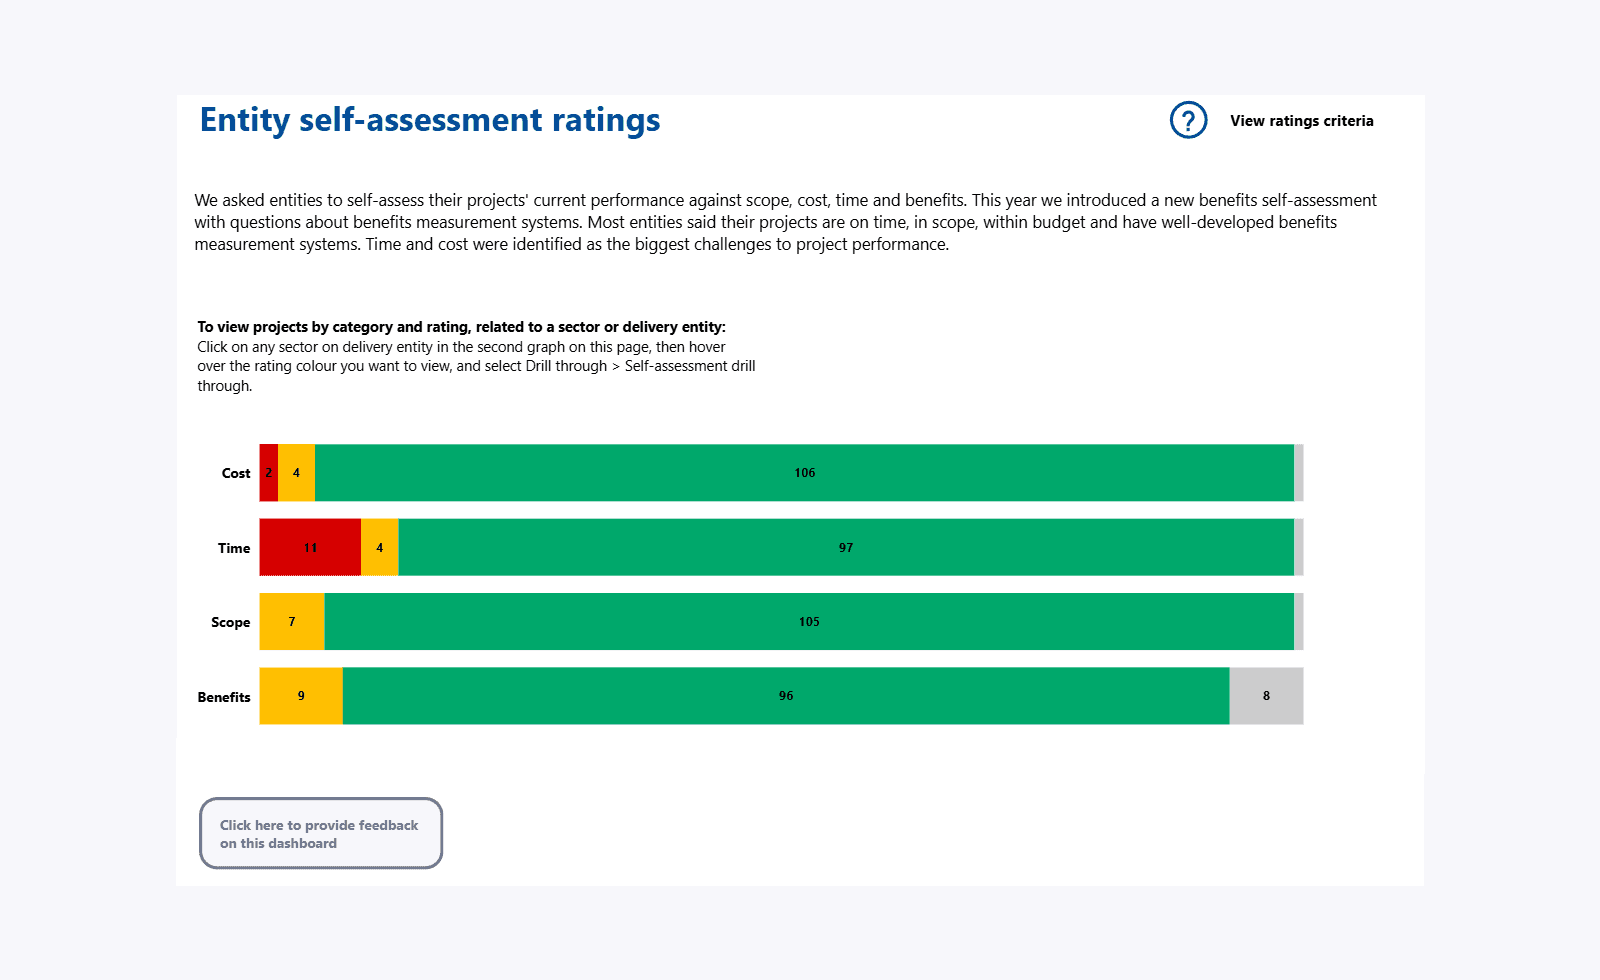
A companion interactive dashboard built in Microsoft Power BI and hosted on the VAGO website
VAGO approached us to help understand where the current PDF and interactive dashboard approaches were falling short for their key audience members. And, using that information, provide research and best-practice-based recommendations to improve the content, design, and functionality of the 2024 report (launched in 2025).
The challenge
This was a high-stakes public reporting product with a diverse audience, from analysts to MPs and electoral staff.
VAGO wanted to understand where the PDF and dashboard were falling short, and what practical changes would make the experience clearer, more usable and more accessible.
A key constraint was the dashboard platform itself. Because the companion experience is built in Power BI, the interaction model, layout behaviour and UI patterns are tightly governed by the tool. That created a unique design challenge: improving the usefulness of the experience without proposing changes that Power BI could not realistically support.
Starting with the people
Given the highly technical nature of the reporting, it was critical to understand how end-users were engaging with and understanding the presented content.
To this end I ran a series of user interviews with three core audience groups:
Members of Parliament
Analysts
Electoral staff
The goal of the interviews was to understand the following about the different audience members:
Roles and responsibilities
How the report intersects with their work
What they seek to get out of this reporting and how that knowledge is put to use
How they typically access this data
What they understood the data to represent
How this reporting would ideally support them given their needs
In addition to the interviews I also ran monitored user testing sessions where, via remote viewing, I observed participants as they worked their way through both the PDF report and the Power BI dashboard. These sessions were crucial in understanding participants ability to find, digest and use the data provided in each format.
Key research insights
The most important insight was that the experience could not assume user knowledge. Members of Parliament and other associated roles need to be across a wide range of different policy areas, of which Major Projects is but one. With so many areas, each with their own specialist knowledge, it is unreasonable to expect audience members to understand the provided information without significant assistance. Without the right framing and explanations, people struggled to interpret what the data meant and how to use it.
That finding reshaped the design direction: the report experience needed to actively support knowledge-building, giving users the context and tools to reach their own conclusions.
Applying best practice
Research surfaced behavioural issues, but it could not cover every aspect of readability, structure, accessibility and presentation. I therefore completed a best-practice audit across both products to identify additional opportunities to improve usability, navigation, accessibility and overall clarity.
A key emphasis here was turning findings into specific enhancement activities, not broad or vague advice, so the VAGO team could confidently act on the work.
Designing the solution
Where our recommendations could easily be applied to the PDF reporting, the Power BI interactive dashboard needed a more direct design approach.
Power BI limitations were not treated as an afterthought, they shaped the solution.
It wasn't enough to show an idealised version of the reporting, but one that worked within the limits of the platform. The solution focused on:
Simpler navigation and clearer information hierarchy (so users can orient quickly)
Prioritisation of the most important content for key audiences
Stronger accessibility and support to make interpretation easier
Improved data clarity through structure, labelling and better framing
Improving performance through improved data structures
The goal was to make the experience feel purpose-built, even within a constrained embedded reporting tool, so users could access information quickly and intuitively without a background in data analysis.
The result
At the project's conclusion I provided:
Evidence-based research insights and a clear articulation of user needs
A best-practice audit with actionable opportunities to improve usability, readability, navigation and accessibility
Indicative wireframes for the 2024 companion dashboard, translating findings into feasible design and functionality improvements
The project equipped VAGO with a practical pathway to optimise the 2024–25 Major Projects Performance Report experience for usability, accessibility and comprehension, strengthening the report’s role in supporting transparent public sector reporting.
Client feedback highlighted the usefulness of the insights and the strength of the actionable recommendations for uplifting the product.
"[This] was exactly what we needed for the evolution of this product and will also be useful for other VAGO products, helping us to focus on what our key report users want to see. The actionable recommendations resonated strongly with the Auditor-General and will help our data science and publishing teams uplift the product into an enhanced experience with clear analysis and clean design."
Paul O'Connor, Senior Manager, Audit and Planning, VAGO


